INTRODUCTION
Suppositories are a dosage form which administered by rectum. They are used for local or systemic action. They also are designed in suitable size and shape to be easily for administration. The good properties of suppositories are shown by the releasing of drug to site of action and give the desired effects after this dosage form is administered by the patient.
As usual characteristic in formulation, the drug which will incorporate in suppositories formulation must be compatible with suppositories’ base. The good or ideal suppositories’ base must have certain characteristics such as melt in body temperature or dissolve in body fluids, solidify quickly after melts, easily moulded and removed from mould, chemically stable, easy to handle, non-toxic, and non-irritant. The different composition of suppositories’ base in a formulation can influence the rate of releasing the drug from the suppositories. It also can influence the physical characteristic of those suppositories. In this experiment, we are instructed to do several suppositories formulation with different composition of suppositories’ base. The result will be discussed.
OBJECTIVE
To study the effects of cooperating different composition of bases on the physical characteristics of the suppository formed and its release rate of drugs.
APPARATUS AND MATERIALS
Weighing balance
Weighing boat
Spatula
50ml and 100ml beaker
Hotplate
5ml Measuring cylinder
Suppository mould
Water bath
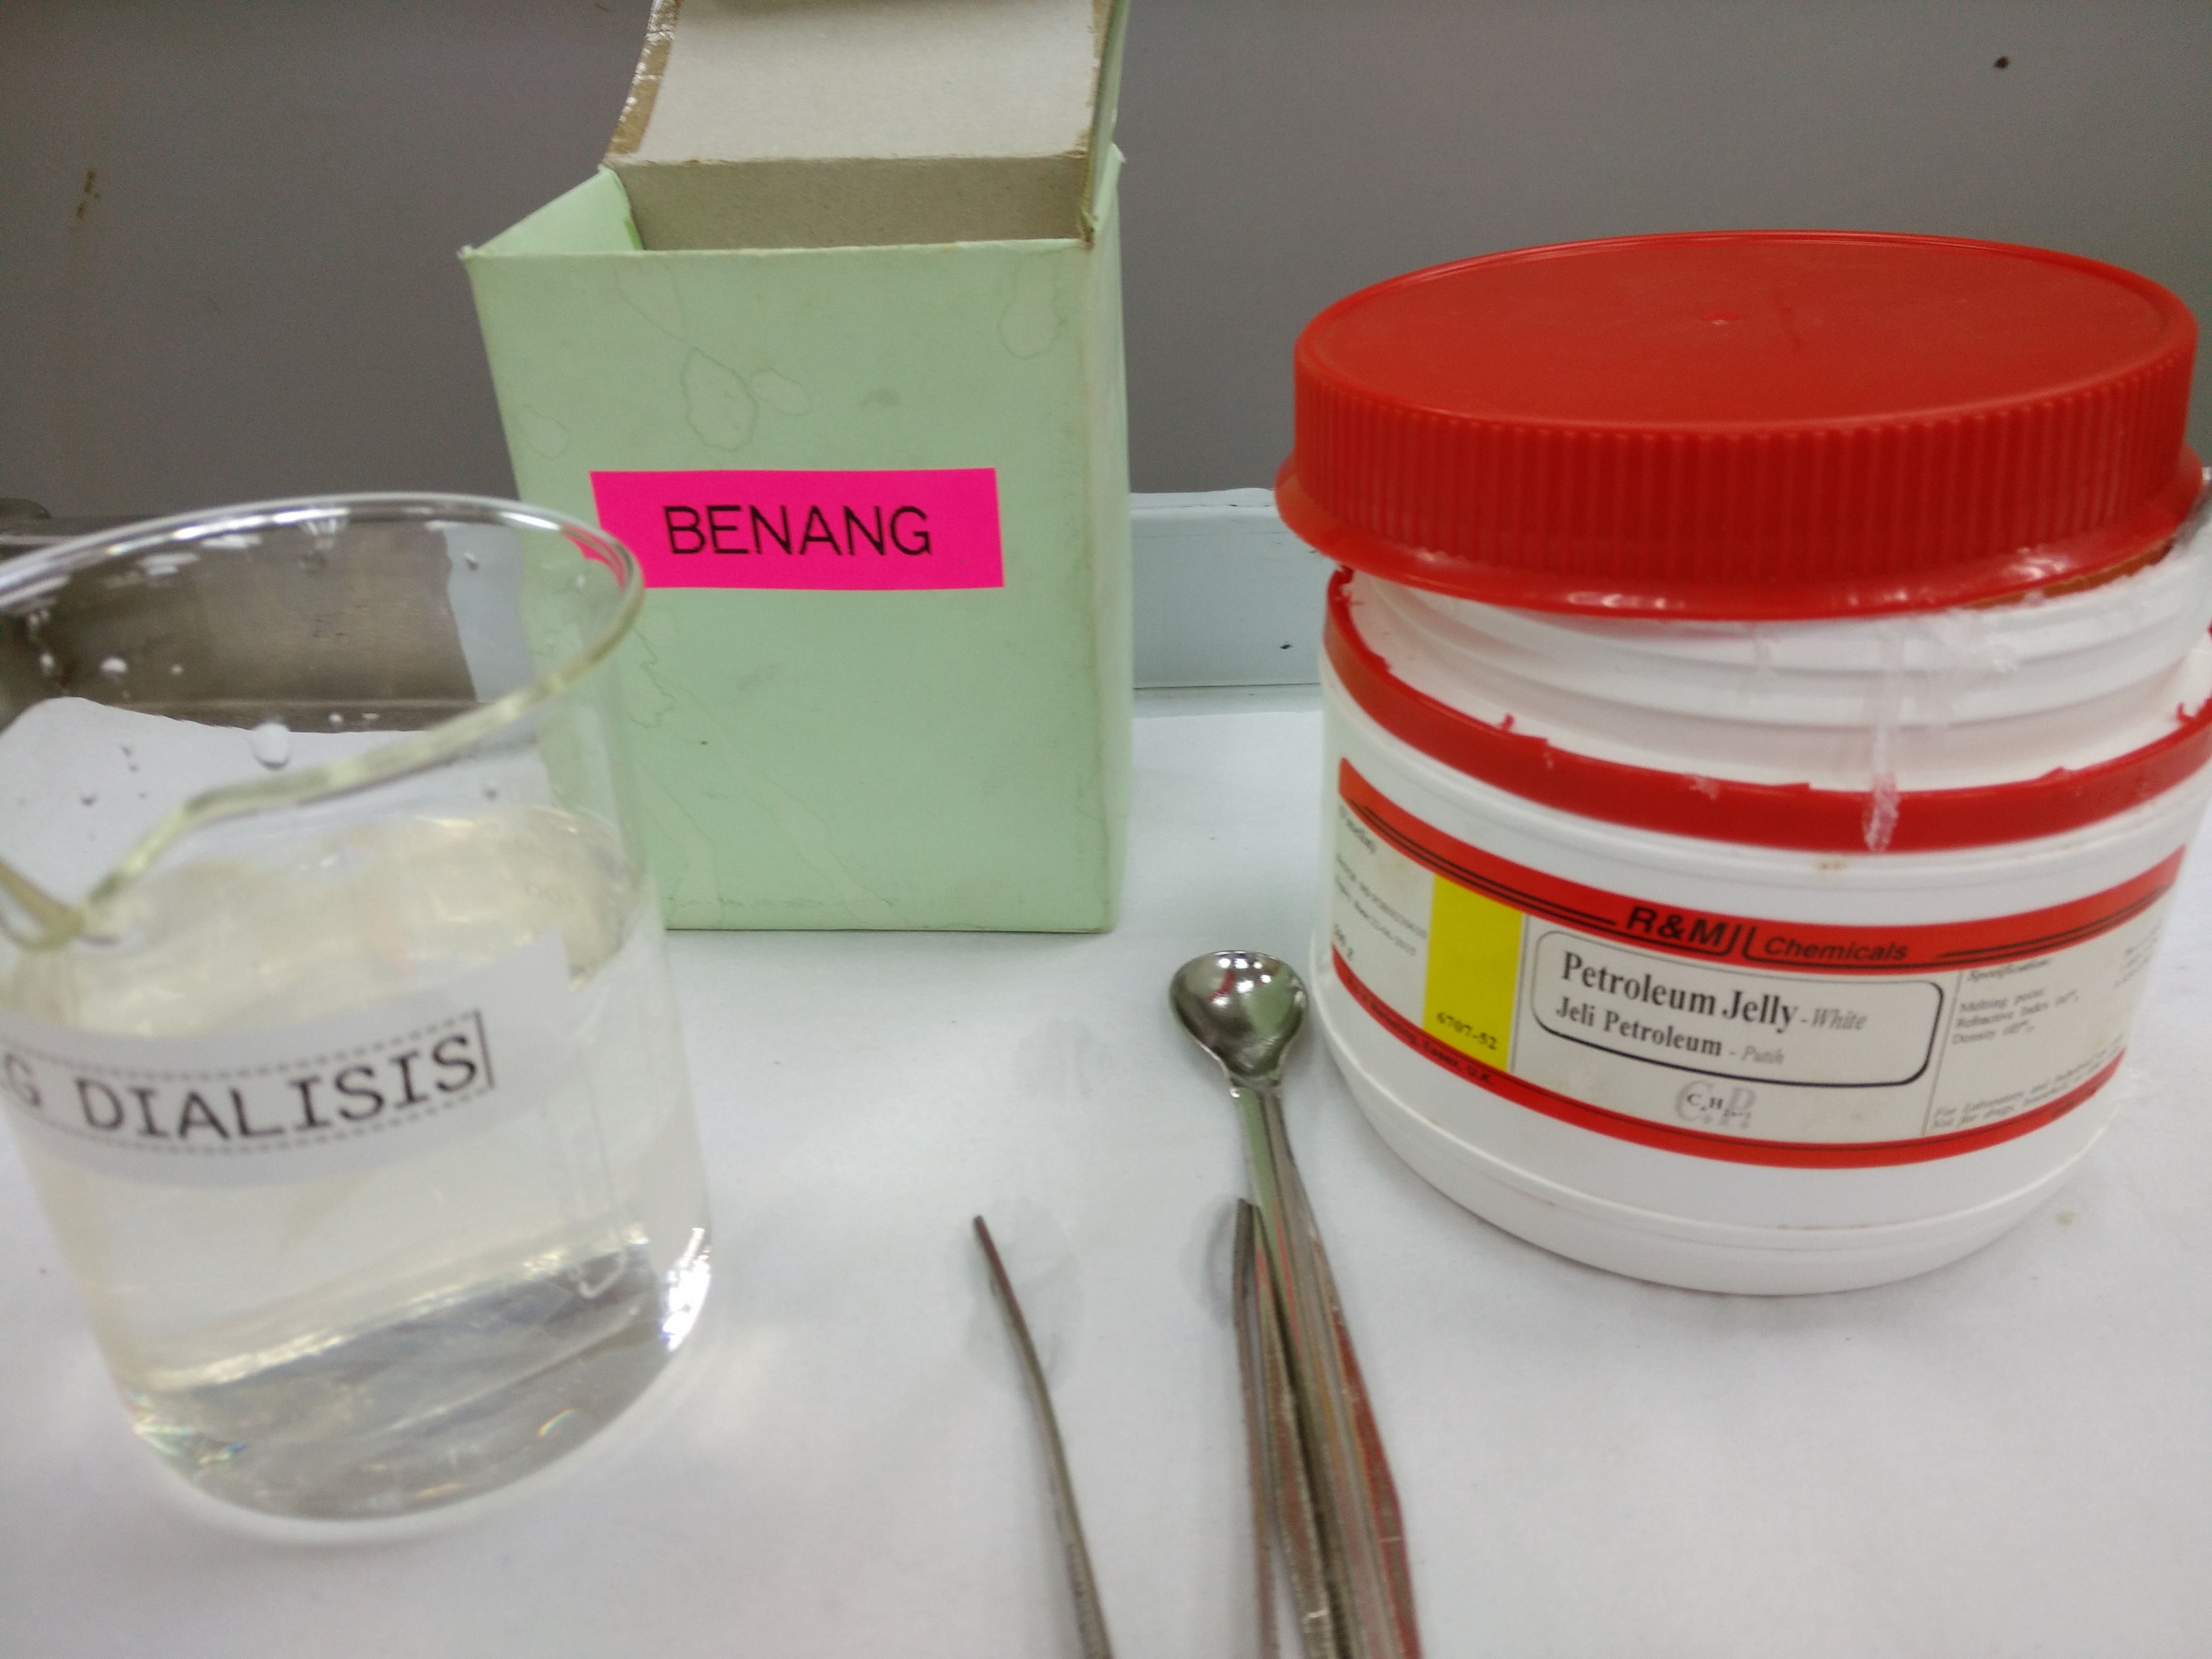
10 cm Dialysis beg
Thread
Glass rod
5ml Pipette
Pipette bulb
Plastic Cuvet
UV Spectrometer
PROCEDURE
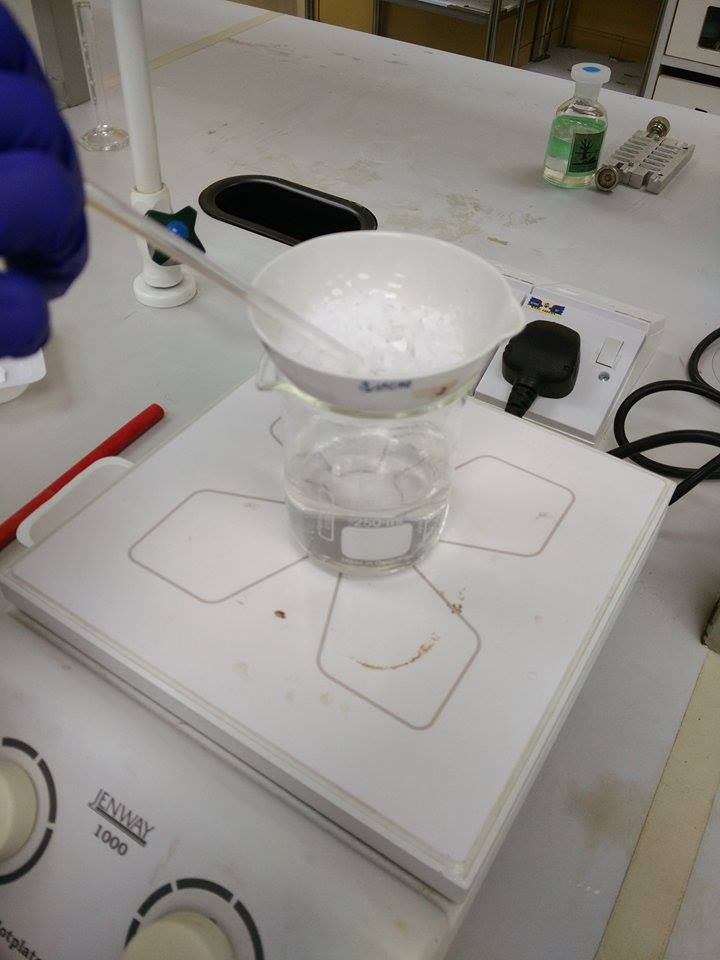
- Paracetamol stock solution was prepared by dissolving 10g paracetamol in 5 mL distilled water.
- Paracetamol suppositories were prepared based on the following formula:
| Suppository | Group | Ingredient | Paracetamol Stock Solution (g) | Total (g) | |
| PEG 1000 | PEG 6000 | ||||
| 1 | 1,5 | 9 | 0 | 1 | 10 |
| 2 | 2,6 | 6 | 3 | 1 | 10 |
| 3 | 3,7 | 3 | 6 | 1 | 10 |
| 4 | 4,8 | 0 | 9 | 1 | 10 |
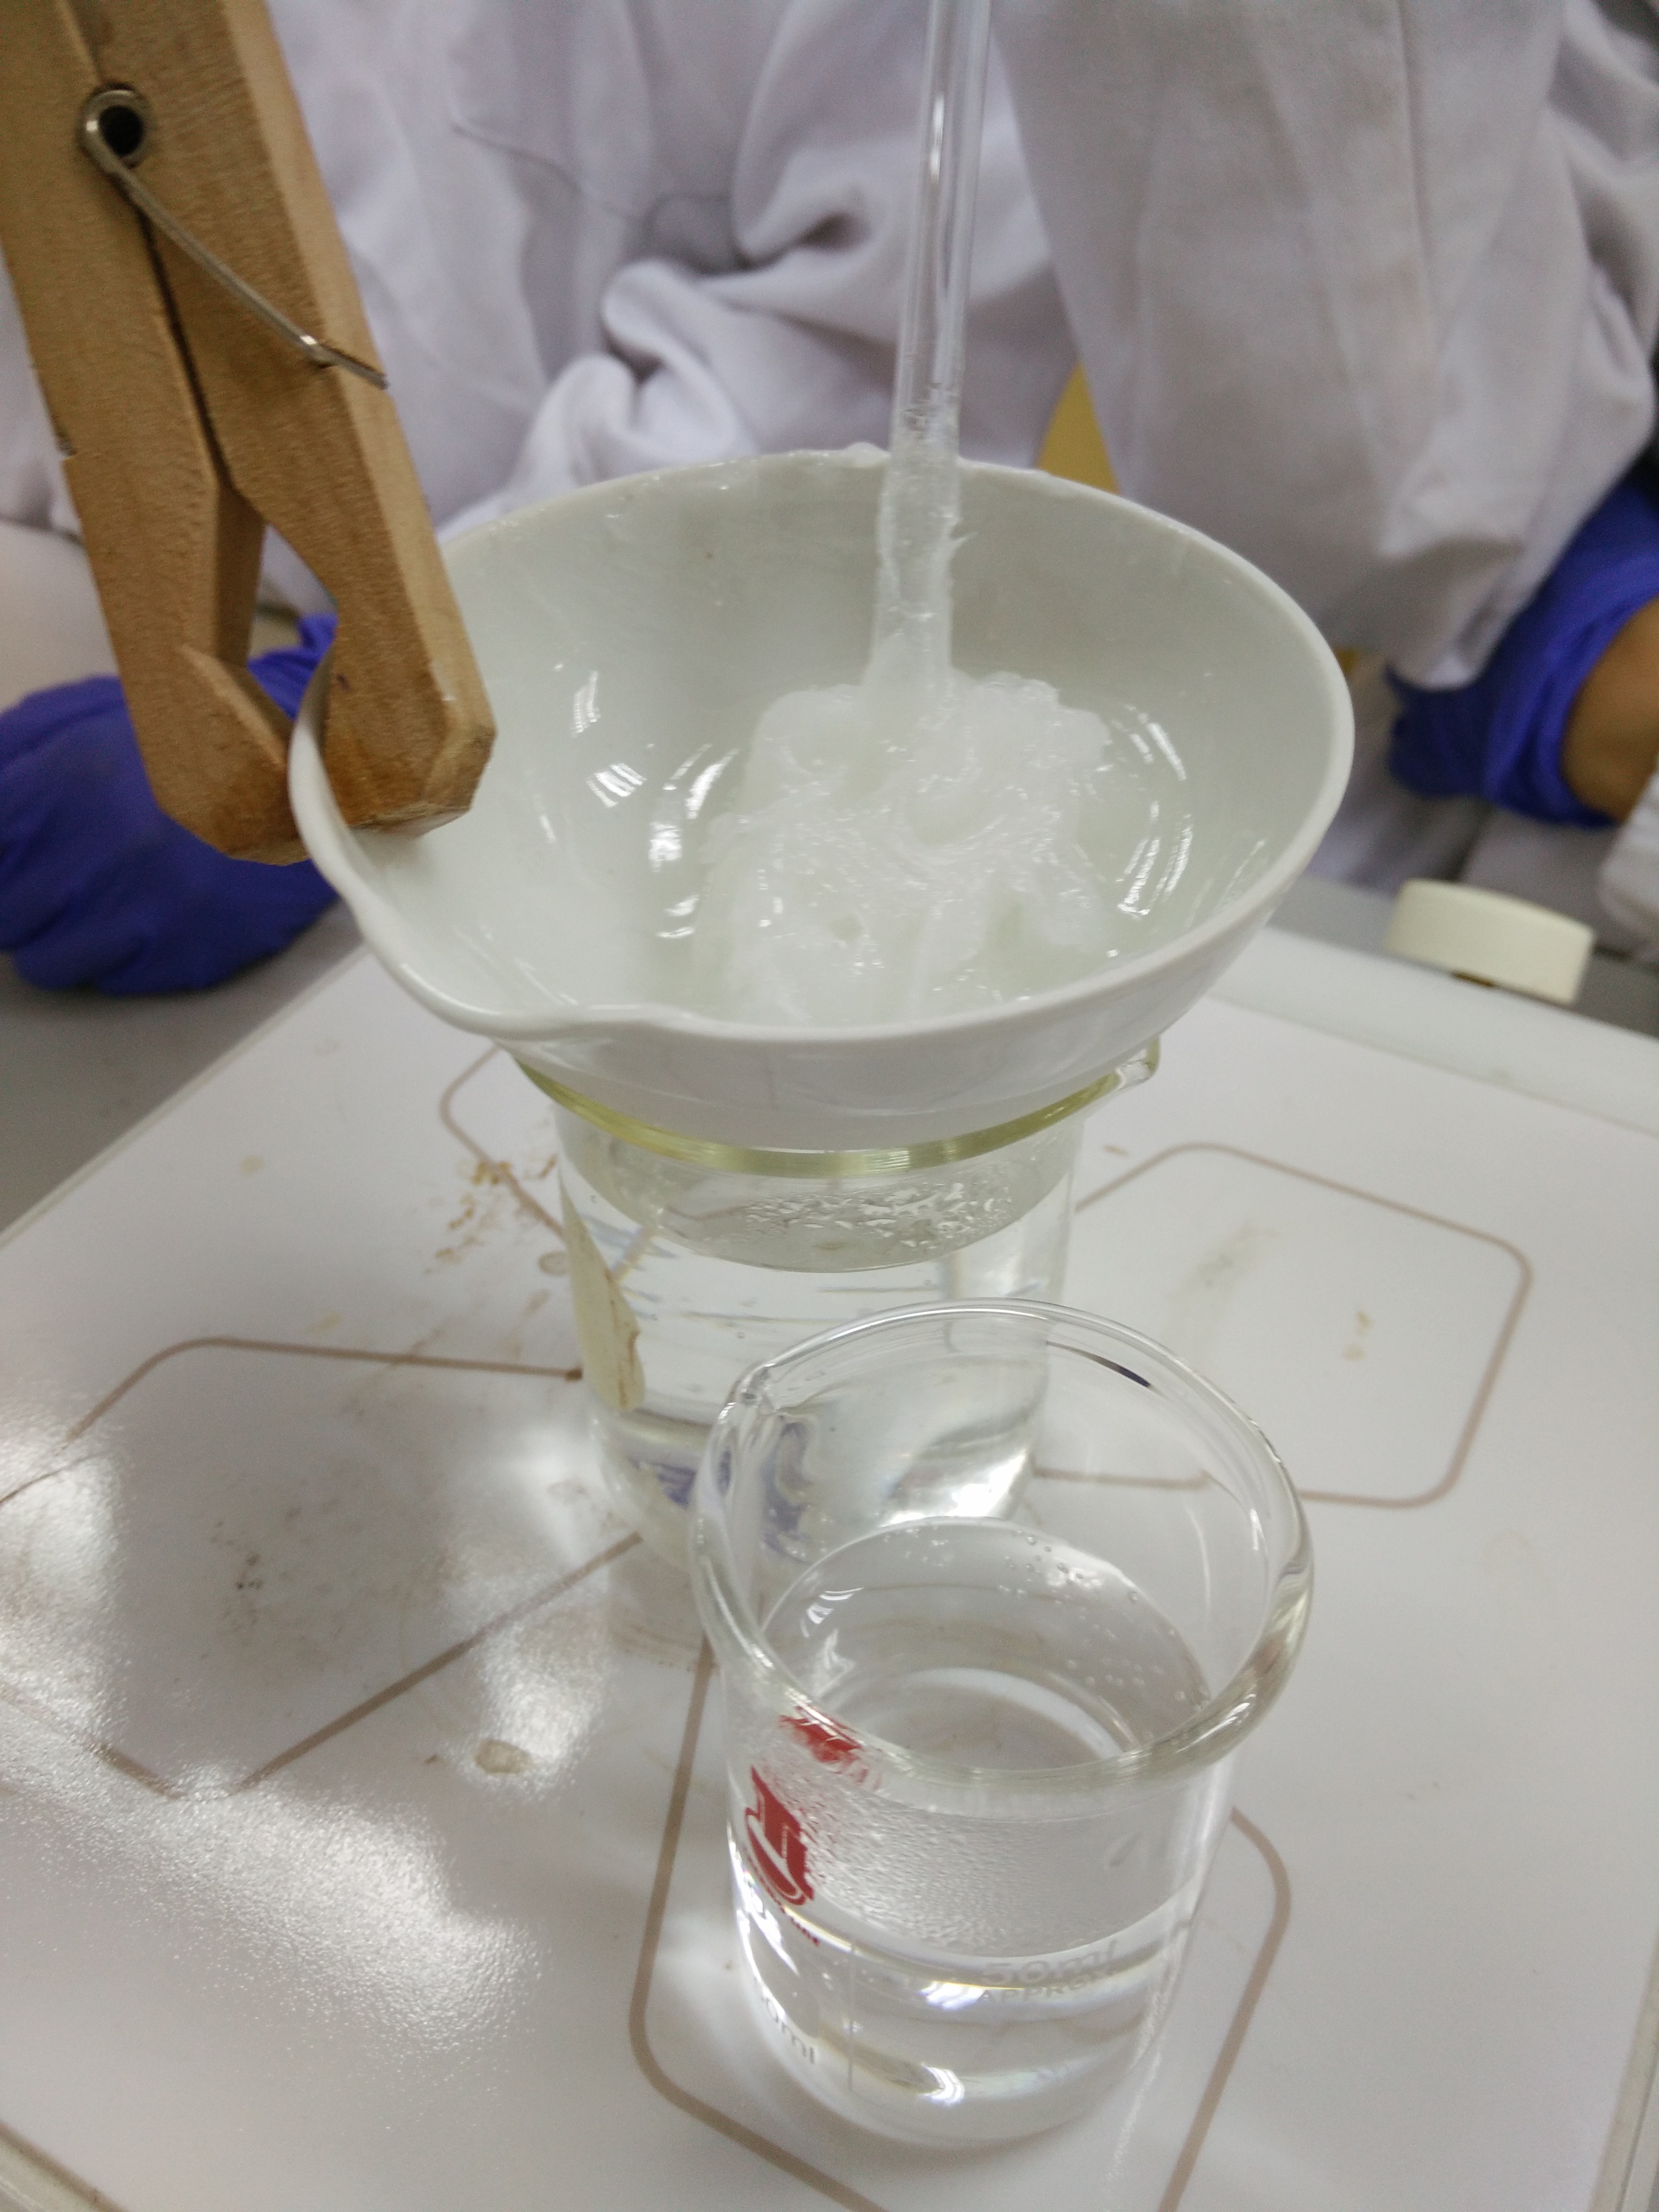
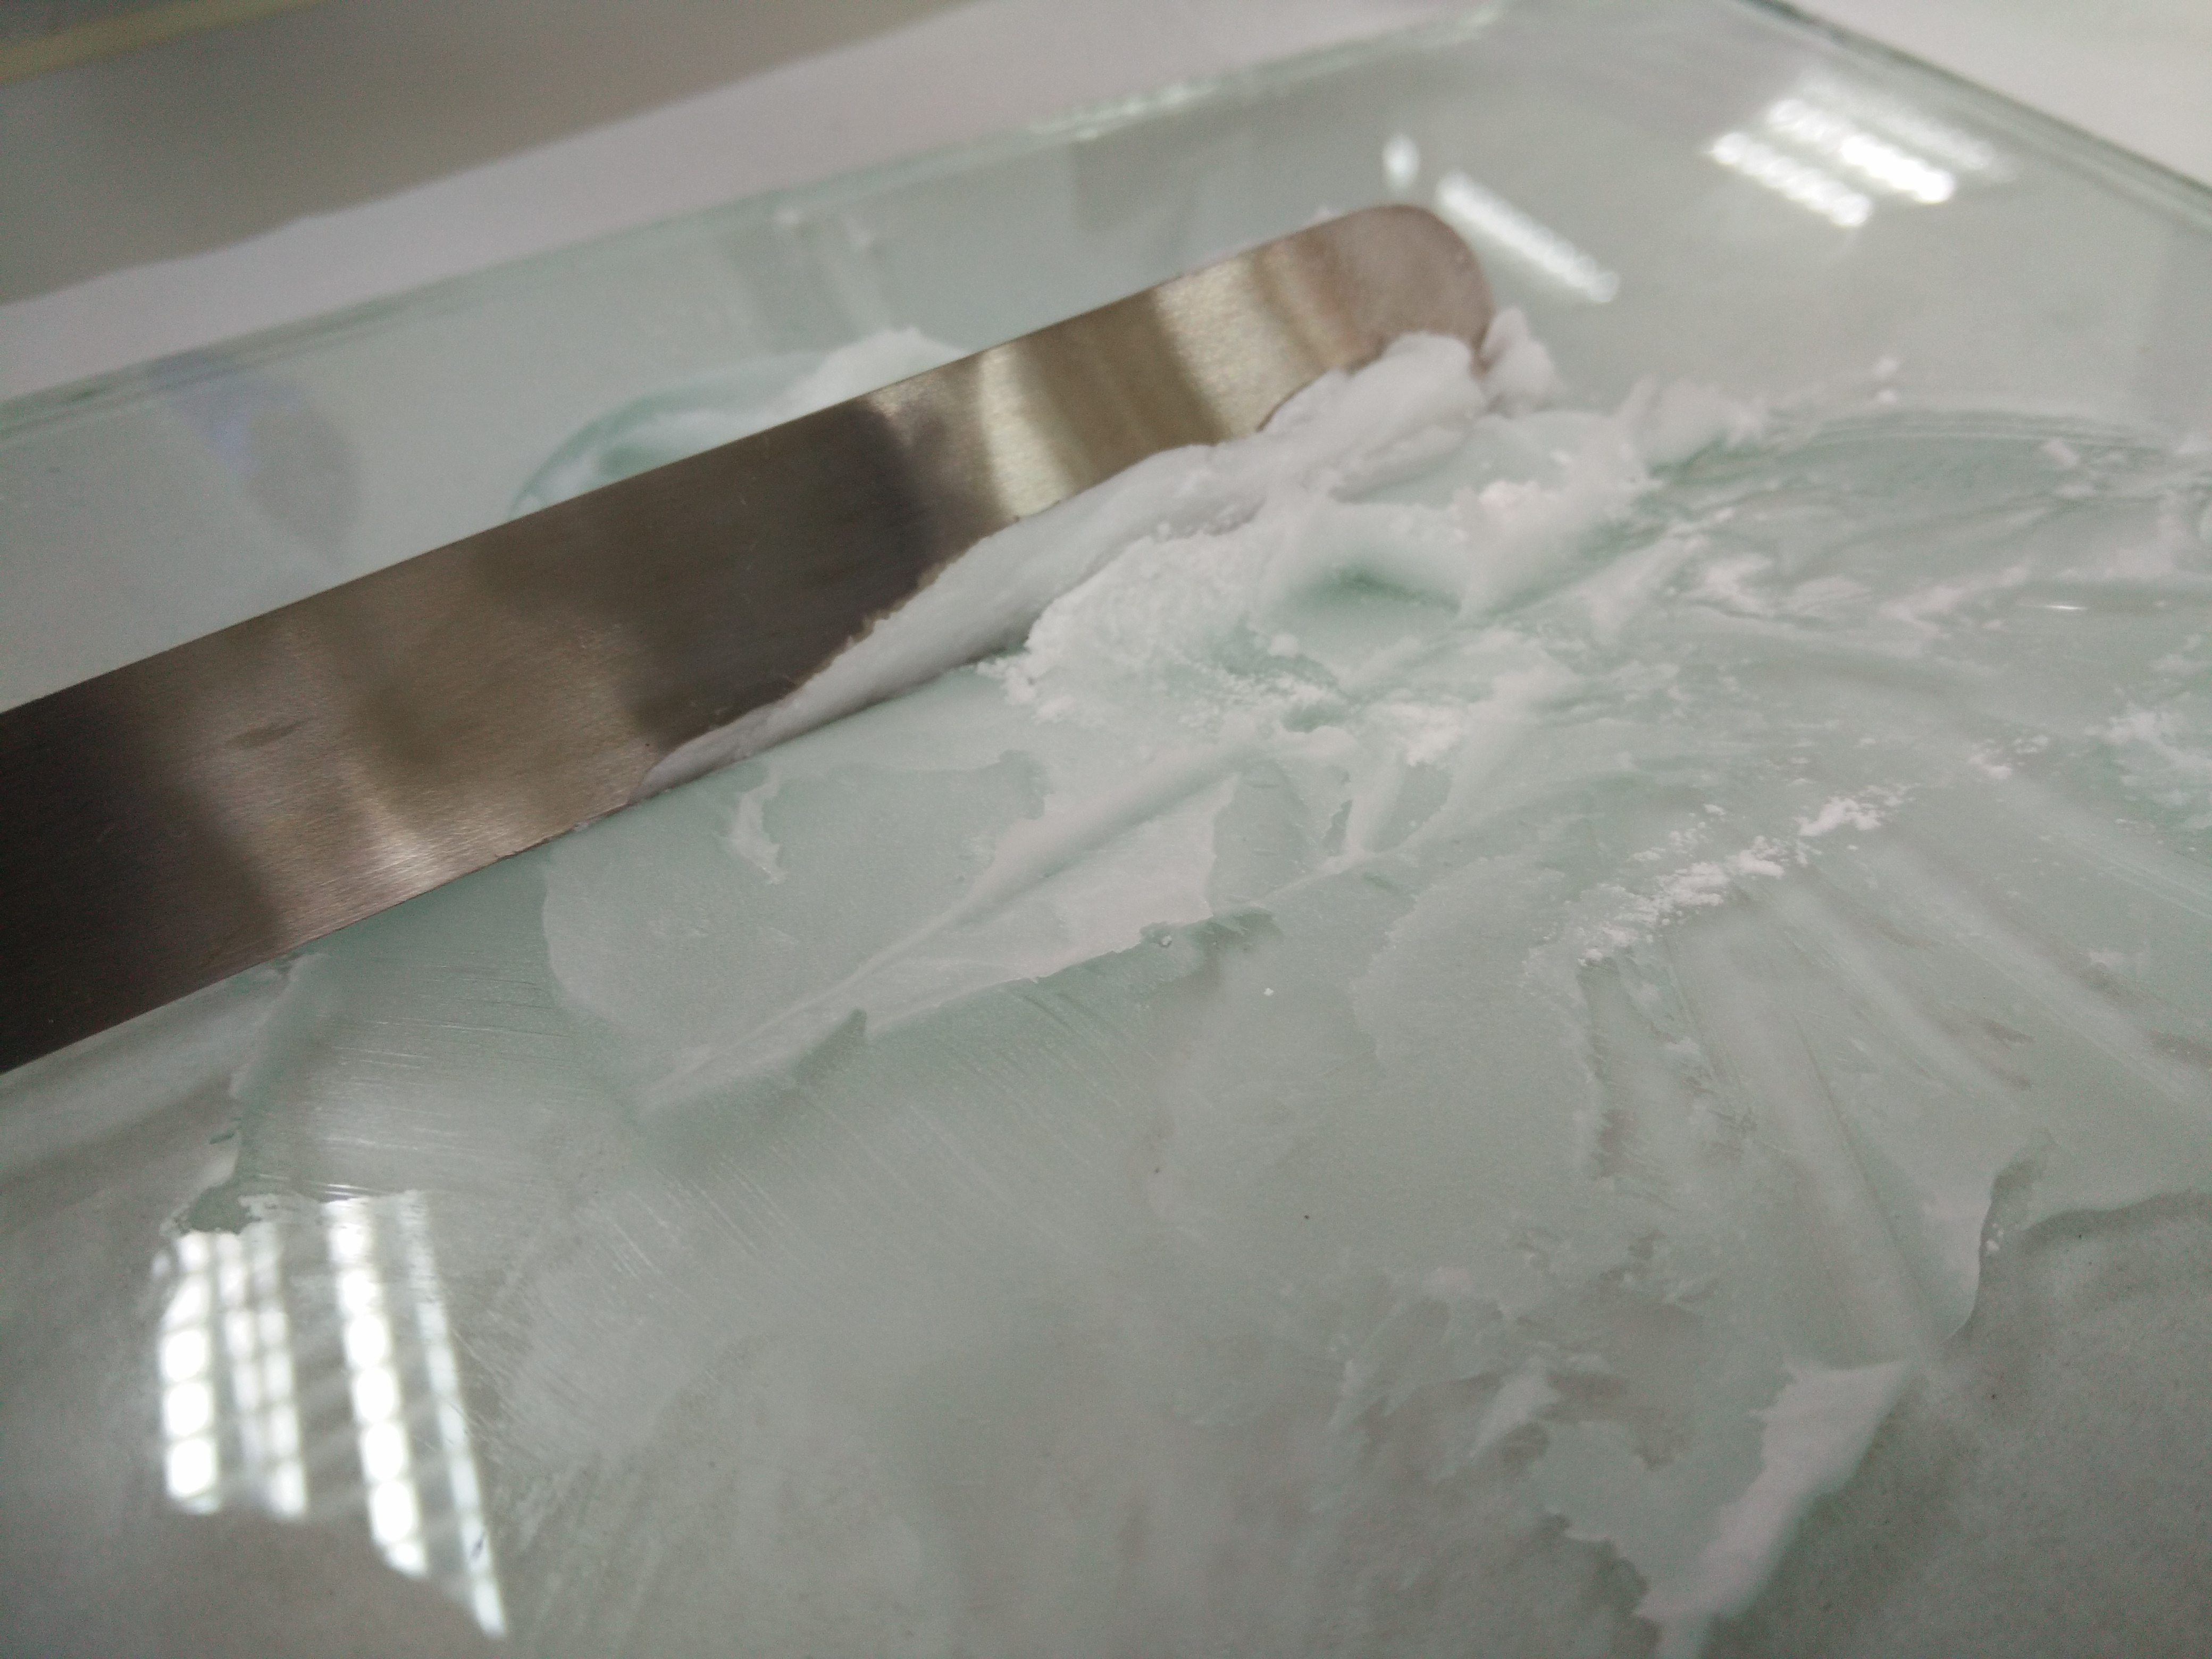
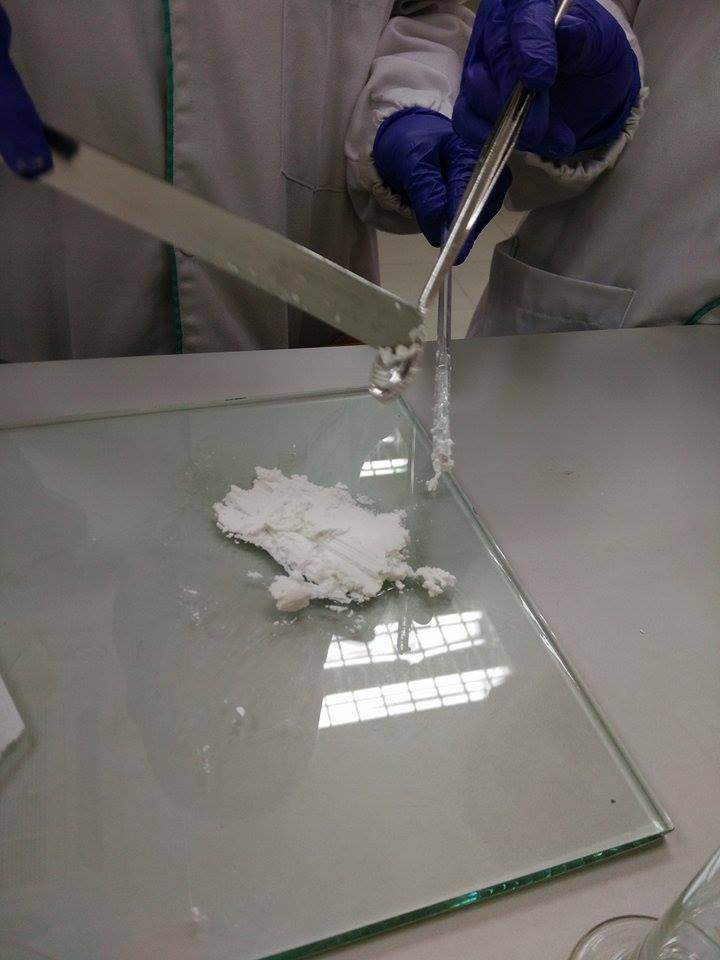
- A suppository mould was used to shape the suppository.
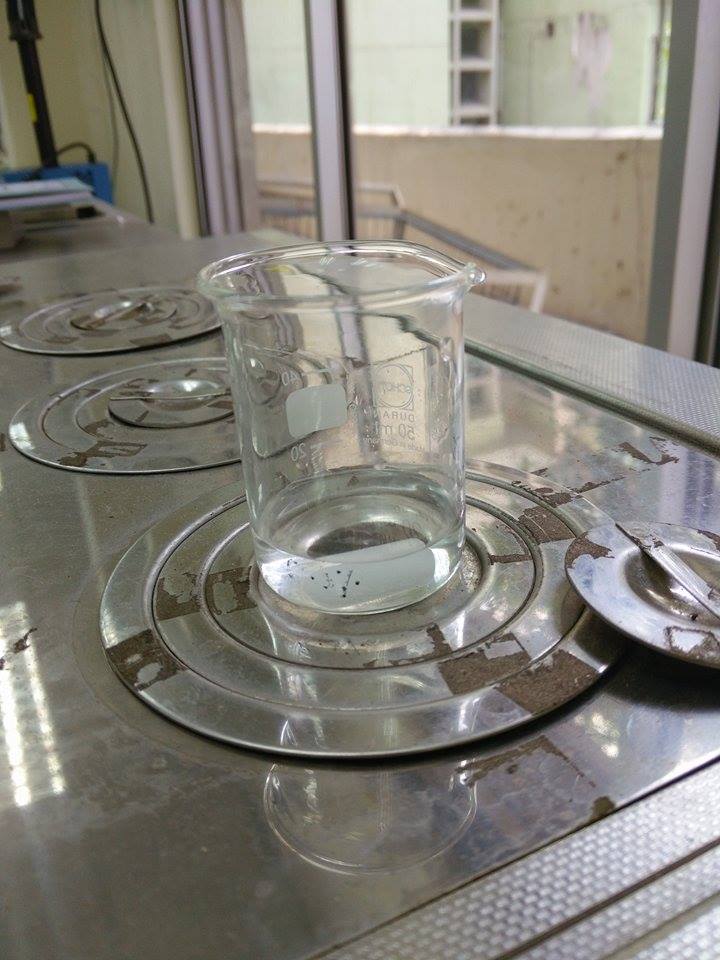
- After the suppository harden, one of the suppository was put in a beaker containing 10 ml of distilled water maintained at 37o The time taken for the suppository to completely melt was taken.
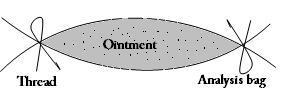
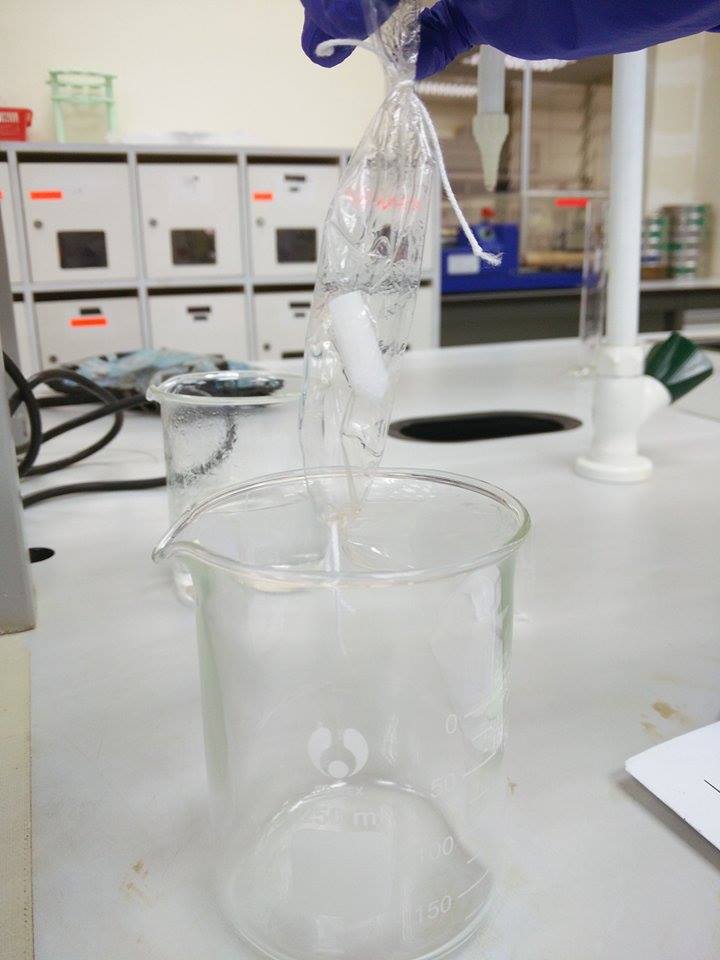
- Another suppository was inserted in a dialysis bag. Both ends of the dialysis bag were tied tightly. The bag was put in a beaker containing 50mL distilled water that was maintained at 37o
- At every 5 minutes interval, a sample aliquot was pipetted and aracetamol release from the suppository was determined using UV-visible spectrometer. The water inside the beaker was stirred before taking the sample.
QUESTIONS
1) Compare the physical appearance of the suppositories and give explanation.
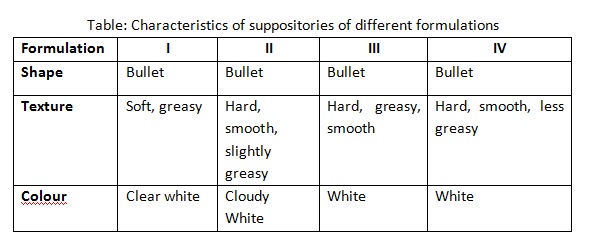
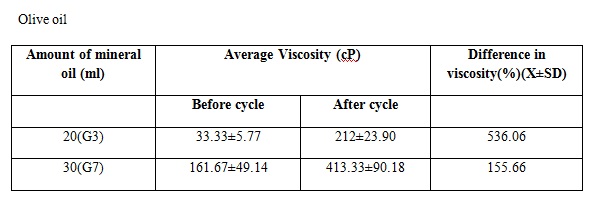
The table above shows the comparison between the physical appearances of suppositories in different formulations depends on the effects of different amount of the Polyethylene Glycol (PEG) in the suppository base mixtures. All the four suppositories produced are bullet-shaped following the shape of mould and they are in white tone.
The two bases used in this experiment are PEG 1000 and PEG 6000. Since PEG 6000 consists of more hydroxyl (-OH) bonds in its chemical structure, it shows greater hydrophilicity compared to PEG 1000. Hence, the suppositories become less greasy from formulation I to IV. From the results, it is found that the hardness of the suppositories increases with increasing amount of PEG 6000. This is due to the physicochemical characters of PEG 6000 forms more strong and stable hydrogen bonds in the suppository compared to PEG 1000. This explains why suppositories with more PEG 1000 and less PEG 6000 are softer.
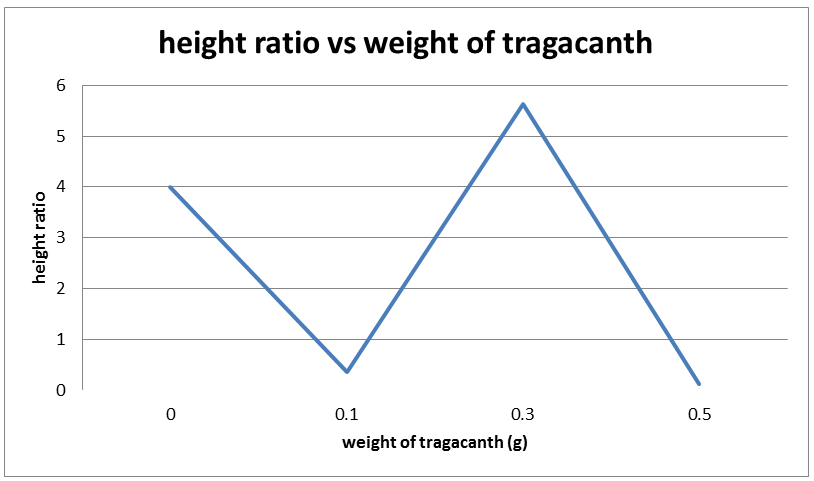
2. Plot a graph of the time needed to melt the suppository vs. the amount of PEG 6000 in the formulation. Compare and explain the results.
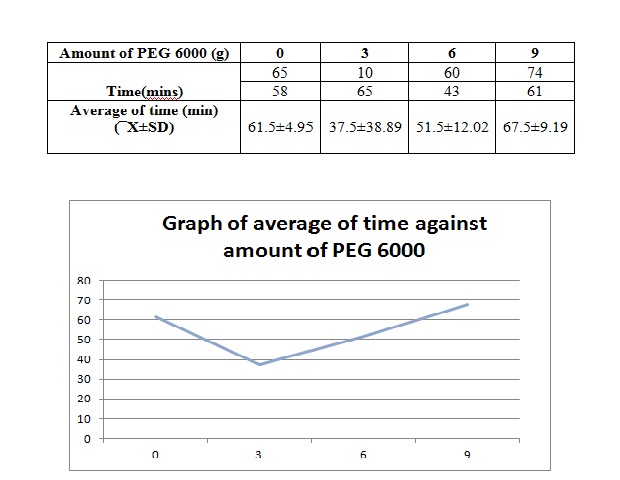
The time needed for the suppository to melt is 74.00 minutes for our group.
Based on the graph above, the average time needed for the suppository to completely melt decreases initially until PEG 6000 3ml and increases with the increase of the amount of PEG 6000 starting from 6mg. The time needed for the suppository with 0g of PEG 6000 to melt is supposed to be the shortest. However, errors may have occured in the procedure of this experiment. The increase of the time needed is due to the presence of hydroxyl(OH) group in the suppository. The higher the amount of PEG 6000 used, the more the OH group that will be present in the suppository. Therefore, there will be more hydroxyl group forming hydrogen bond with paracetamol. With the increase in the formation of hydrogen bond, the suppository formed will be harder and time needed to completely melt the suppository will increase in water. This is because time needed for the dissociation of the hydrogen bond is more difficult with the increase in the formation of the hydrogen bond. From the graph, it can be seen that the average time needed for the suppository with 9g PEG 6000 increases abruptly after the time needed for suppository with 6g PEG 6000
The inaccuracy of the result might due to the inappropriate temperature where higher temperature will increase the melting of the suppository, producing the shorter time needed as measured in for 3g PEG 6000. Besides, the accidental addition of water from the water bath into the beaker containing suppository will also increase the dissolution of suppository as more water to dissociate the hydrogen bond. A Noyes-Whitney equation of dissolution can explain the theory behind where the additional water will reduce the value of C, concentration of solid in bulk solution.
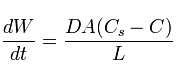
 is the rate of dissolution.
A is the surface area of the solid.
C is the concentration of the solid in the bulk dissolution medium.
Cs is the concentration of the solid in the diffusion layer surrounding the solid.
D is the diffusion coefficient.
L is the diffusion layer thickness.
With the decrease in the value of C, the value for (Cs – C) will be larger. Hence, the rate of dissolution will be faster, time taken for the suppository to melt will be shorter. Another error that might cause the inaccuracy may be due to the stirring of water when the suppository is melting by using glass rod. Hence, these errors has to avoided in order to improve the accuracy of the experimental result.
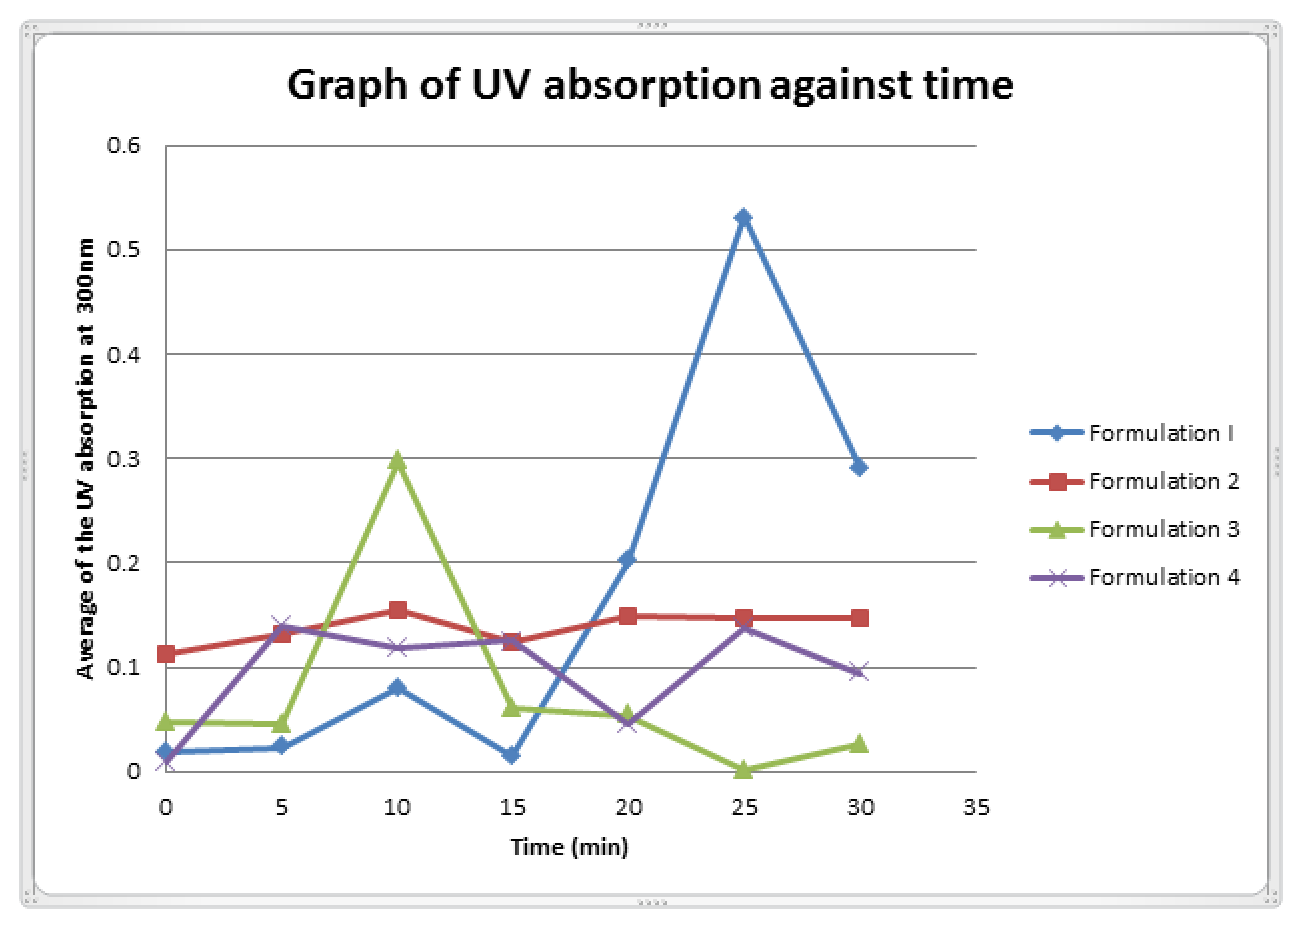
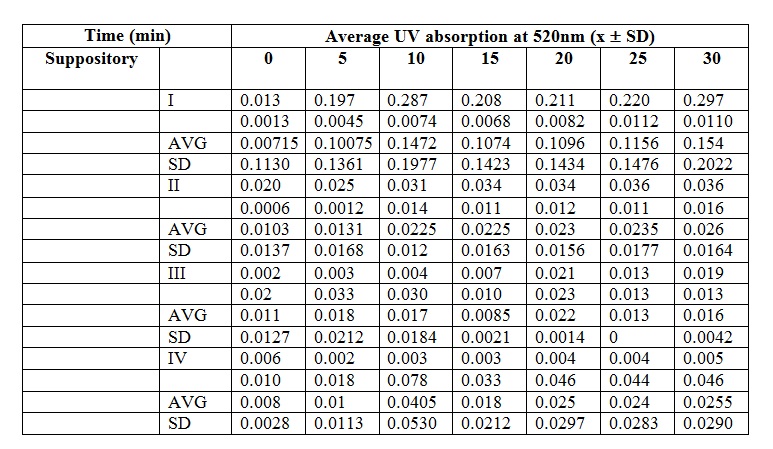
3) Plot UV absorption against time graph. Give comments.

The suppository was immersed in a water bath that is maintained at 37oC to imitate the normal body temperature. The dialysis bag imitates the biological membrane at the rectum.
As time passes, the pattern of average UV absorption increases gradually which tells the amount of paracetamol released from the dialysis bag. The drug released will be absorbed by the UV ray thus giving a reading proportional to the drug content. At the first 5 minutes, the paracetamol release is more rapid as compared to the later stage of the experiment. This may be due to the concentration difference between the inside and outside of dialysis bag, thus allowing a more rapid diffusion of paracetamol out from the dialysis bag.
However, there are two constant reading at minutes 10 to 15, and 20 to 25. This can be due to errors while conducting the sampling. For example, the water bath is not properly stirred before taking the sample eliquot, thus giving lower value if the sample was taken far from the dialysis bag and vice versa. The cuvette may also not cleaned properly, thus giving impuritites that can interfere with the UV absorption.
To have a suppository that melts at body temperature is important to ensure maximum drug diffusion through the rectum lining. However, the formulation must be able to melt only within the body temperature’s range to prevent insufficient drug delivery to the rectum due to excessive melting, leakage or wastage upon application of the dosage form. The suppository also must melt gradually because if it takes too long to melt, it will give unpleasant feeling to the patient and if the suppository melts too quickly, it may cause the liquid to leak out from the rectum.
4) Plot a graph of UV absorption against time for formulation suppository that have different composition. Differentiate and discuss the result.
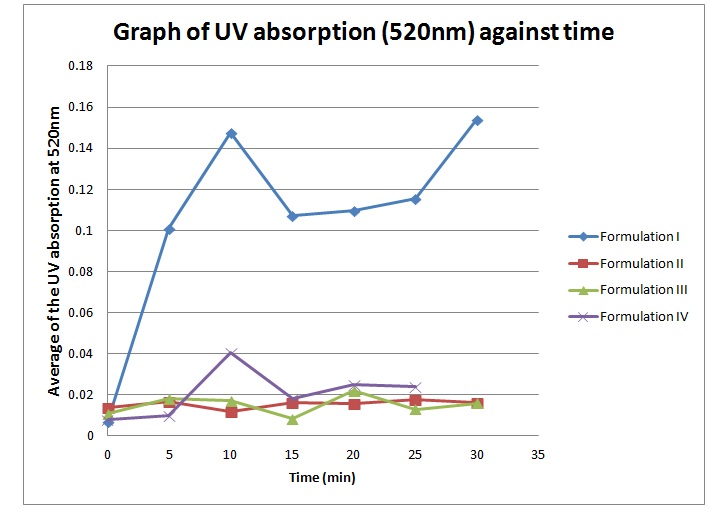
Theoretically, the graph obtained should obey the sigmoid curve. But, all the graph obtained by us does not obey the sigmoid curve. The results obtained shown on the graph are increased and decrease at several times. The result shows the unusual sigmoid curve. According to the experimental result obtained, Formulation I suppository has the highest peak, followed by Formulation IV, II and III. Beer-Lambert Laws states that the higher the absorbtion of UV, the higher the amount of drug in the solution. This means that Formulation I has the highest drug release rate compared to the other formulations. While the Formulation III has the lowest drug release rate.
Formulation I and IV suppository have higher peak than Formulation II and III. This means Formulation I and IV have higher drug release rate compared to Formulation II and III. Theoretically, the ideal formulation for suppository to have the highest drug release rate is 40% of PEG 1000 and 60% of PEG 6000. So, the ideal formulation used in this experiment should be the formulation III which contain 33.33% of PEG 1000 and 60% of PEG 6000. The higher the percentage the PEG 6000 used, the higher the drug release rate. This is because PEG 6000 will enhance the drug release. But, too high percentage of PEG 6000 will decrease the drug release rate instead of enhance it. Based on the results obtained from experiment, the suppository that shows highest release rate is from Formulation I. This may be due to some experimental errors occur.
Theoretically, formulation I has the lowest drug release rate because the absence of PEG 6000 in the formulation. Although there is PEG 1000 in the formulation, it only has little effect on drug release. PEG 6000 has much more influence on drug release compared to PEG 1000. But the result that we get is contraindicated with the theory.
Although formulation IV has the highest percentage of PEG 6000, it does not show the highest drug release rate. This is because too many PEG 6000 will cause the formation hydrogen bond between PEG and paracetamol. It requires the longer time to reach the highest value of drug release, as the suppository is the hardest. As a result, the drug release rate decreases. The inaccurate result that we get from the experiment is due to some error happen when conducting the experiment. Example of errors that happen are uneven stirring of the solution, unstable temperature, mistake in the suppository formation and impurities can all lead to the experimental errors.
5) What is the role of each ingredient used in the preparation of this suppository? How PEG 1000 and PEG 6000 affect the physical characteristic of the formulation and drug release of suppository ?
PEG act as carrier bases, solubilisers and absorption improvers for the drugs. PEG such as PEG 1000 and PEG 6000 that is used in this experiment increases the effective dispersion and delivery of drugs through the rectal route by diffusing out from the PEG as PEG degrades.
Active ingredient in this formulation is Paracetamol. Basically it is used as therapeutic agent in this suppository. It is an anti-pyretic agent, and it is also known as a pain-killer. It is commonly used for the relief of headache and minor pain.
When water diffused in, PEG 1000 will miscible with water evenly where the drug can dissolves in water. Therefore, constant rate of release of drug can be achieved while PEG 6000 has the characteristic of higher viscosity make it less available to miscible with water. This causes the drug to be difficult to diffuse out into the water. As increased of PEG molecular weight resulted in decreased solubility in water and solvent.
CONCLUSION
Different portion of combination of PEG 1000 and PEG 6000 affects the physical characteristics of the suppository and the rate of release of the active ingredient. The lower the molecular weight of the PEG, the higher the hydrophilicity, as it has higher hydroxyl value as compared to higher molecular weight PEG.
REFERENCES
1. http://pharmlabs.unc.edu/labs/suppository/bases.htm
2. http://www.pharmacopeia.cn/v29240/usp29nf24s0_c1151s68.html